Contour Mapping and Elevation Data
Contour mapping represents terrain elevation through continuous lines connecting points of equal height. High-accuracy contour data provides a clear understanding of terrain shape, slopes, and elevation changes. Our contour datasets support engineering design, infrastructure development, hydrological analysis, and GIS-based terrain modelling, enabling professionals to visualize and analyze landscapes with precision.
What is Contour Mapping?
Contour mapping is a method used to represent terrain elevation through contour lines that connect points of equal height above a reference level. These lines provide a visual representation of the terrain’s shape, allowing planners, engineers, and geospatial professionals to understand slopes, ridges, valleys, and elevation changes.
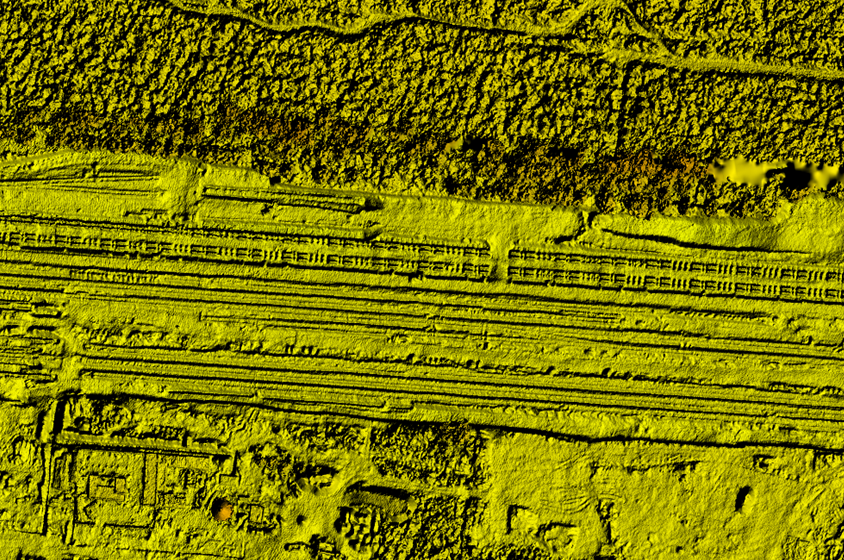
Contour data is commonly derived from Digital Terrain Models (DTM), satellite imagery, LiDAR surveys, or photogrammetric mapping. By converting elevation data into contour lines, geospatial datasets become easier to interpret for engineering design, construction planning, and land analysis.
In GIS and surveying applications, contour maps play an important role in infrastructure planning, watershed analysis, mining operations, and environmental studies. High-resolution contour datasets allow professionals to evaluate terrain conditions, plan development projects, and perform accurate landform analysis across large geographic areas.
Key Features of Our Contour Data
High Precision Elevation Representation
Our contour datasets accurately represent terrain elevation, enabling engineers and planners to visualize slopes, ridges, and terrain variations across project areas.
Ideal for Engineering and Infrastructure Projects
Contour mapping supports road design, construction planning, pipeline routing, and land development projects by providing a clear understanding of terrain elevation changes.
GIS Compatible Data Formats
Our contour data integrates seamlessly with leading GIS platforms, allowing professionals to perform spatial analysis and terrain modelling within existing geospatial workflows.
Derived from High-Resolution Terrain Models
Contour lines are generated from high-resolution digital terrain models and elevation datasets, ensuring reliable and consistent terrain representation.
Applications of Contour Mapping
Road and Transportation Engineering
Contour maps help engineers design roads and transportation networks by analyzing terrain slopes and elevation changes along project corridors.
Construction and Land Development
Developers and construction planners use contour data to evaluate land suitability, plan grading operations, and optimize building placement.
Watershed and Hydrological Analysis
Contour mapping supports drainage analysis and watershed modelling, helping hydrologists understand how water flows across terrain.
Mining and Resource Planning
In mining operations, contour data helps assess terrain conditions, plan excavation sites, and manage land rehabilitation activities.
Environmental and Land Management
Environmental planners use contour maps to study terrain features, monitor landscape changes, and support sustainable land-use planning.